Debugging Drupal Code
Debugging PHP can be a game changer in Drupal development. In the context of L3D in combination with the composer plugin Docker4Drupal this is provided out of the box and configured very easily. We describe the steps for PhpStorm, but other IDEs should be very similar.
As XDebug comes with a performance hit, it is turned off by default. When you
need it, simply call ahoy debug on in you L3D container of the project you
want to debug and the scripts will reconfigure the PHP container and refresh
it with a few seconds. When you've finished debugging, you may want to turn it
off again with ahoy debug off.
XDebug version 3 connects to port 9003 of your IDE and PhpStorm is preconfigured by default to list on that port.
Configuration with L3D Bridge Plugin (recommended)
The easiest way to getting ready for debugging is to install the L3D Bridge Plugin. Download the latest version here and install it into your JetBrains IDE.
Go to Settings->Plugins and select Install Plugin from Disk:
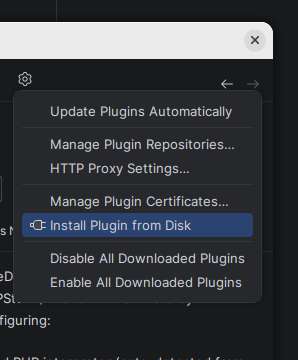
Select the downloaded ZIP file and you are good to go. You can check, if everything is set up correctly in the following chapters where the setup by hand is described.
Add a PHP Server
First, you have to set up a Drupal environment with the tool l3d. The tool is based on Docker containers.
Now navigate to File->Settings in your IDE and create a server:
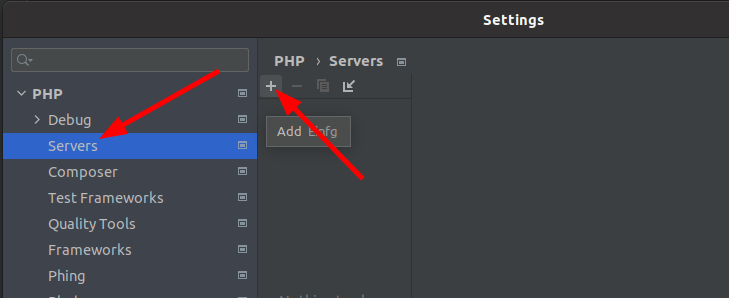
Set the following values:
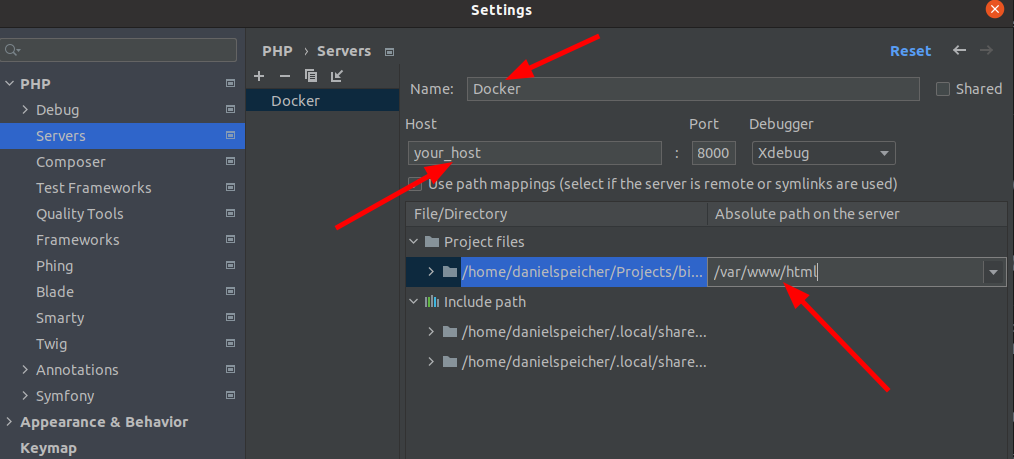
Important: Always use Docker as name of your server.
Do not forget to add the file mapping to /var/www/html.
Important: If using https, the port is 80.
Add a new Run/Debug Configuration
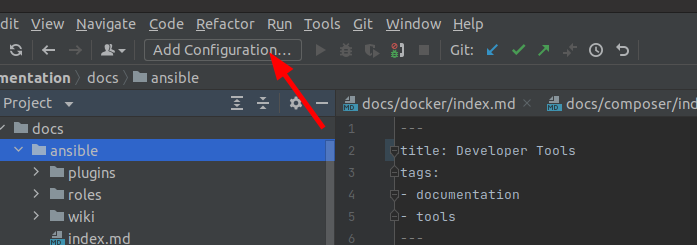
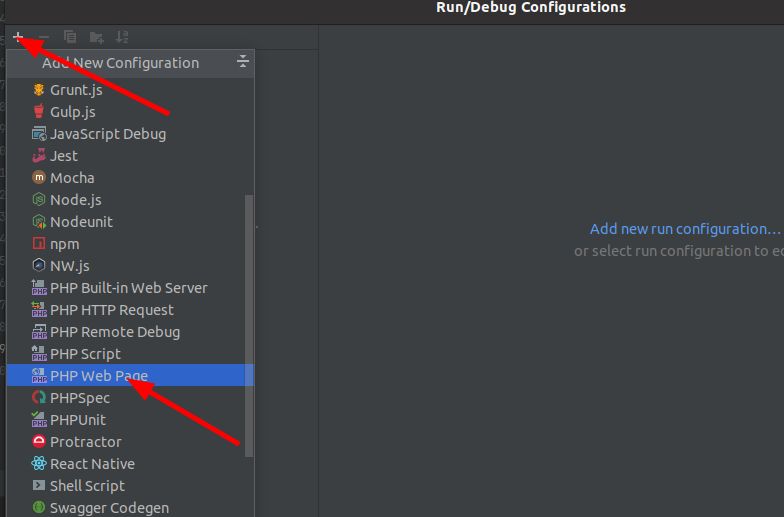
First create a new PHP Web Page configuration:
Set the following values:
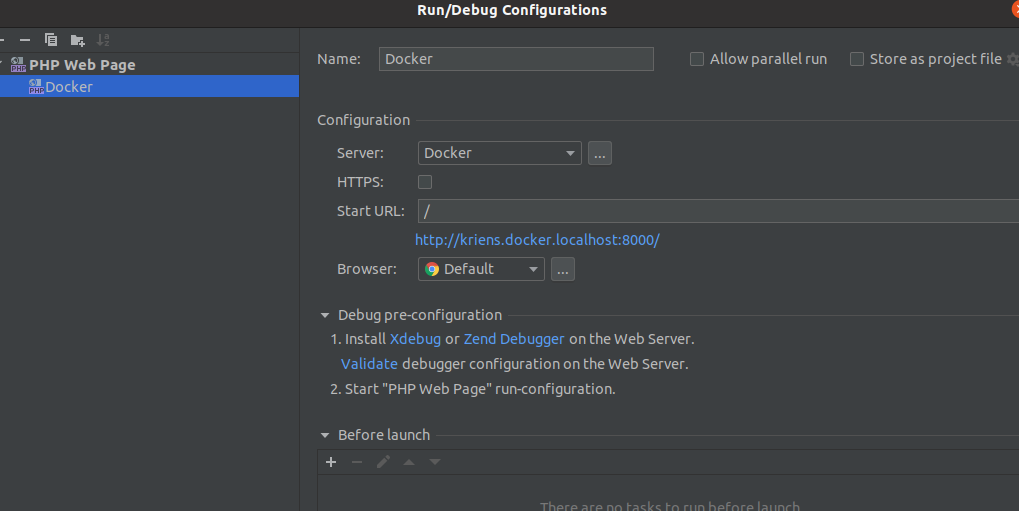
Select the server you just have created.
Important: Always use Docker as name of your configuration.
For using https, do not forget to set the checkbox.
Start Debugging
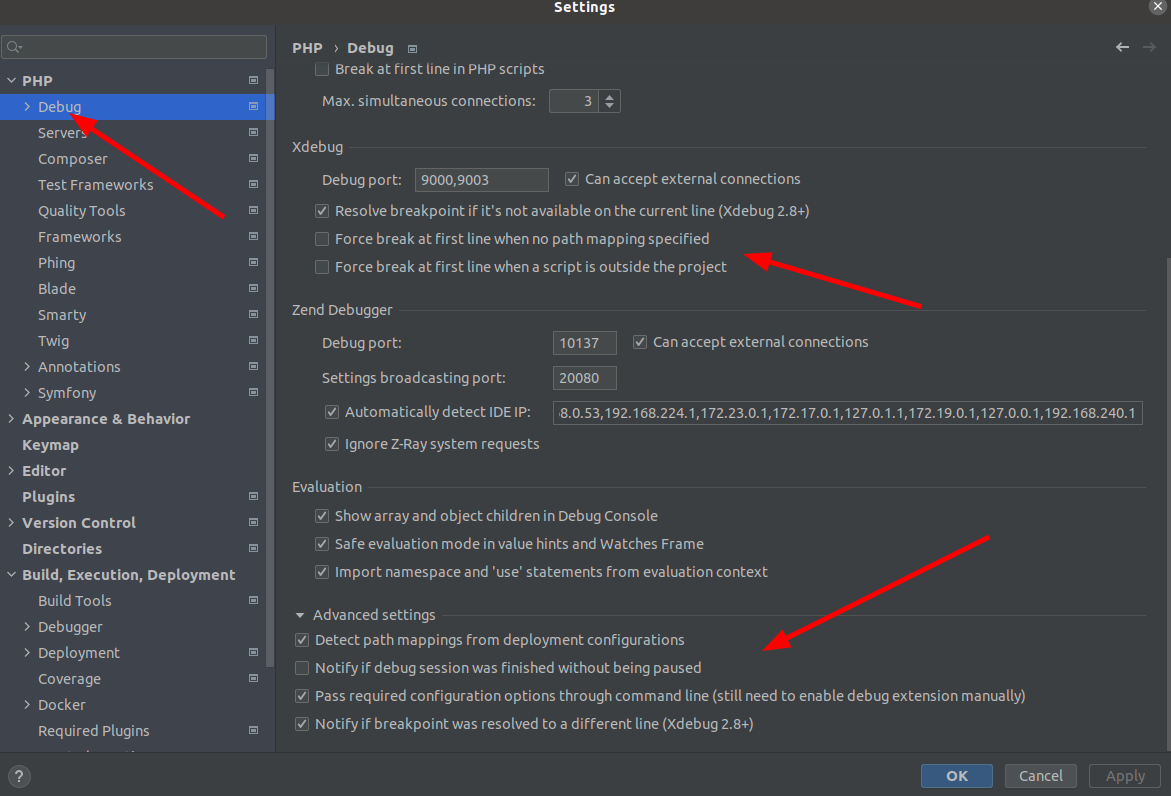
First, check the debug settings in your IDE. It should look something like this:
Now activate the Debug icon on the left in your IDE:
![]()
Now you can set your breakpoints and enjoy debugging Drupal code.